
Nsightful
It took several versions before enough kinks got worked out in Nvidia’s Parallel Nsight Graphics/CUDA debugging application before I could successfully profile my Hierarchical Z-Buffer DirectX 11 implementation.
However, it looks like the latest version which is now completely free with pro level functionality debugs my Hi-Z implementation like a champ!
The tool is really slick. It’s much closer to the experience I’ve wanted to have when debugging the GPU on windows. Thus far it feels much better than the windows version of PIX, with more functionality and information.
I was finally able to get some numbers I trust are more accurate for my Hi-Z DX11 implementation on a GeForce GTX 480.
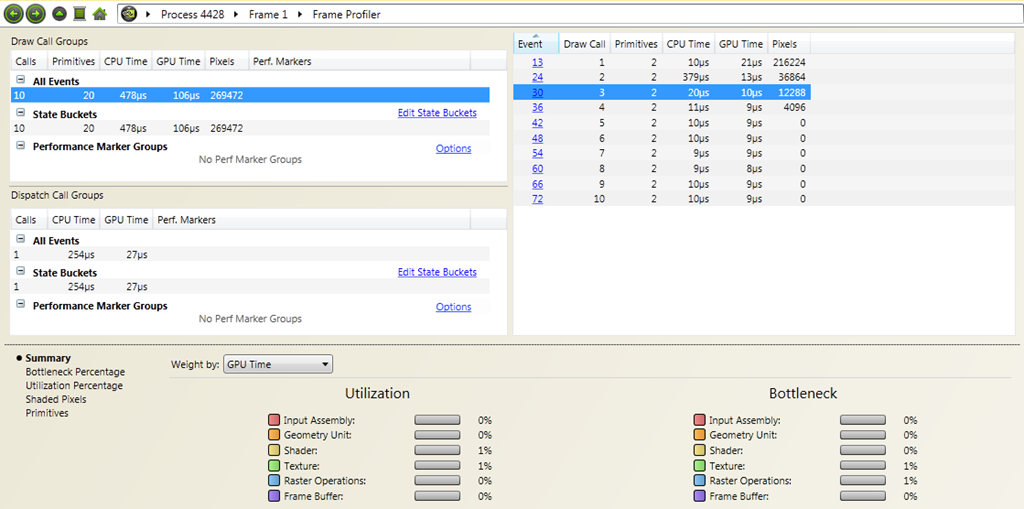
| ?µs | Some number of occluders being rendered |
| 85µs | Downsample the Hi-Z mipchain |
| 27µs | Testing 900 bounds in the compute shader |
So if you extrapolate that data, that’s culling 10,000 bounds for ~0.3 milliseconds of GPU time. Plus however long it takes you to render your occluders, which should hopefully be cheap and crammed into a deferred command list.
I’m sure you could improve upon the performance of my compute shader that does the work of figuring out what should be culled by just better managing the thread groups. I just thought it was great I finally was able to profile my code with Nsight because I’ve tried every time a new version came out and was thrilled to see it working.