
R-Script is Awesome
Background
So I’ve recently been doing a lot of debugging / data analysis, usually in 3D space, or at least data with some associated 3D position. The problem is, I dump all this data and I had no good way of visualizing the data. So, channeling my inner tools programmer I threw together some code and a .Net graphing library to visualize my data. Unfortunately, like most thrown together tools, it only did one thing and required code changes to do anything new.
Feeling underwhelmed with the results, I went looking around for other possible solutions. What I ended up coming across is a programming language called R, or R-Script. It appears to have wide usage in industries interested in statistics and the types of things you might otherwise use matlab for. The difference though, is that it’s free. There are tons of packages, with them you’re able to graph data in 3D, points, lines, surfaces, or just your normal 2D graphs if you like.
Most of the data I was dumping was in the form of *.csv files, because I was previously using excel to graph some data. Well, it turns out R can parse and use them to great effect.
The Solution
The idea ended up being pretty simple, for every *.csv file I wrote out, I wrote out an R-Script that I could double click to visualize the data instantly. Alternatively, if I never had a *.csv file before, I might just write out an R-Script with all the data to visualize, defined directly in script.
Things You Should Know
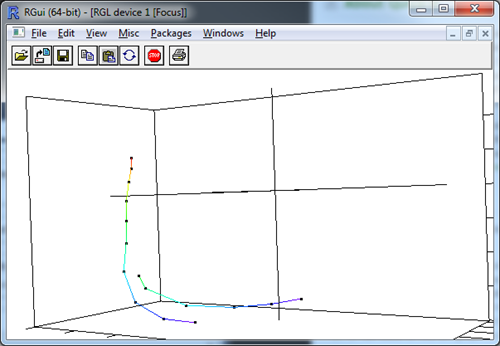
Download R from one of the mirrors listed here.
There are some things you might want to do to make Rgui (The GUI script editor for R) work better than it does out of the box. For one, double clicking an R-Script to launch the tool isn’t possible after installing it.
To make R-Scripts Executable:
- Go to the R etc directory after installing R. For me this was
(C:\Program Files\R\R-2.11.1-x64\etc). - Open the Rprofile.site file.
- Add the following line of script to the bottom of the file, if ( length(z <- commandArgs(TRUE)) ) .First <- function() {source(z[1])}
Then you need to edit your windows program associations so that .R files are opened by the Rgui executable. For Windows 7 this is a lot harder than it should be. I actually had to download a 3rd party tool to let me edit the arguments that are passed to the application associated with R files. I used Creative Element Power Tools.
Once you find a tool that lets you edit the associations, make sure the arguments passed in are,
–no-save –args “%1”
That will make it so the script you click is passed to the app to be opened, and that it wont ask you to save on exit, because that gets super annoying.
Further Reading
I learned how to do most of the scripting at Quick-R. I was throwing together scripts pretty quickly after browsing a few sections on there. I might do a follow-up post in the future to talk about some of the things that would’ve helped me to know about authoring scripts, or some of the basic data structures to be aware of that you can use.